 LEWOS BIOTECHNOLOGYNEUROSCIENCE · PRECLINICAL CROExplore · Discover · Advance

ALS · Amyotrophic lateral sclerosis
Amyotrophic lateral sclerosis
ALS is marked by progressive motor-neuron degeneration and abnormal protein aggregation. Motor function and survival should be quantified together because progression is rapid and variable.
SOD1-G93A offers a stable, literature-rich progression window for survival and motor studies. TDP-43 models provide complementary coverage of mislocalization, aggregation and RNA-metabolism mechanisms.
ALS work combines balance beam, rotarod, wire hang, pole, grip and fine behavior with age-specific validation and model comparison.
- 40+Completed projects
- >10WStable SOD1 window
- 6+Behavior dimensions
- 2Complementary models
Model strategy
Motor function, body weight, survival and neuromuscular pathology.
Match the model and study conditions to candidate mechanism, intervention stage and target tissue.
SOD1-G93A
SOD1 model and progressive motor change
TDP-43
TDP-43 localization, aggregation and function
Evaluation endpoints
- 01Rotarod, grip strength, pole and wire hang
- 02Body weight and survival curve
- 03Spinal neurons and neuromuscular junction
- 04SOD1 / TDP-43 molecular and tissue markers
Representative data
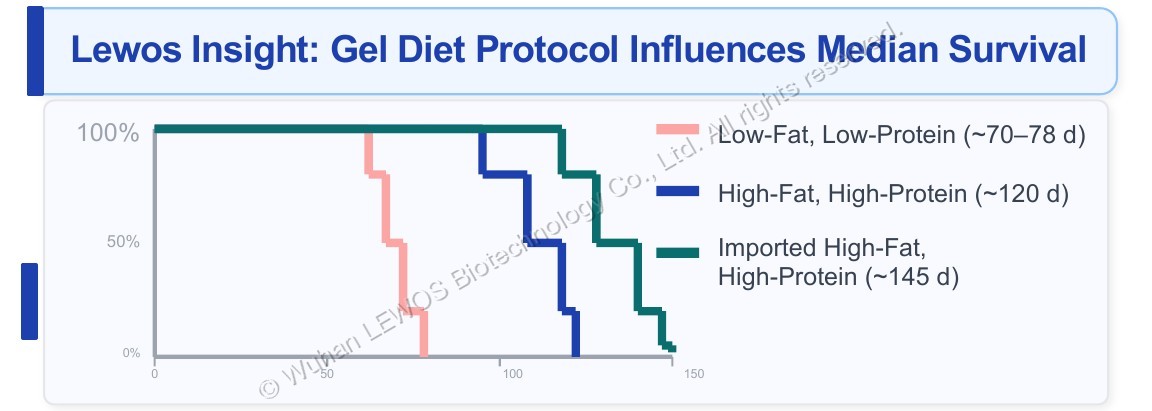
LEWOS exclusive insight: gel-diet formulation directly determines median survival
Kaplan-Meier curves of median survival for gel-diet formulations in TDP-43 mice, comparing three groups — low-fat low-protein (~70-78d), high-fat high-protein (~120d) and imported high-fat high-protein (~145d) — with days on the x-axis.
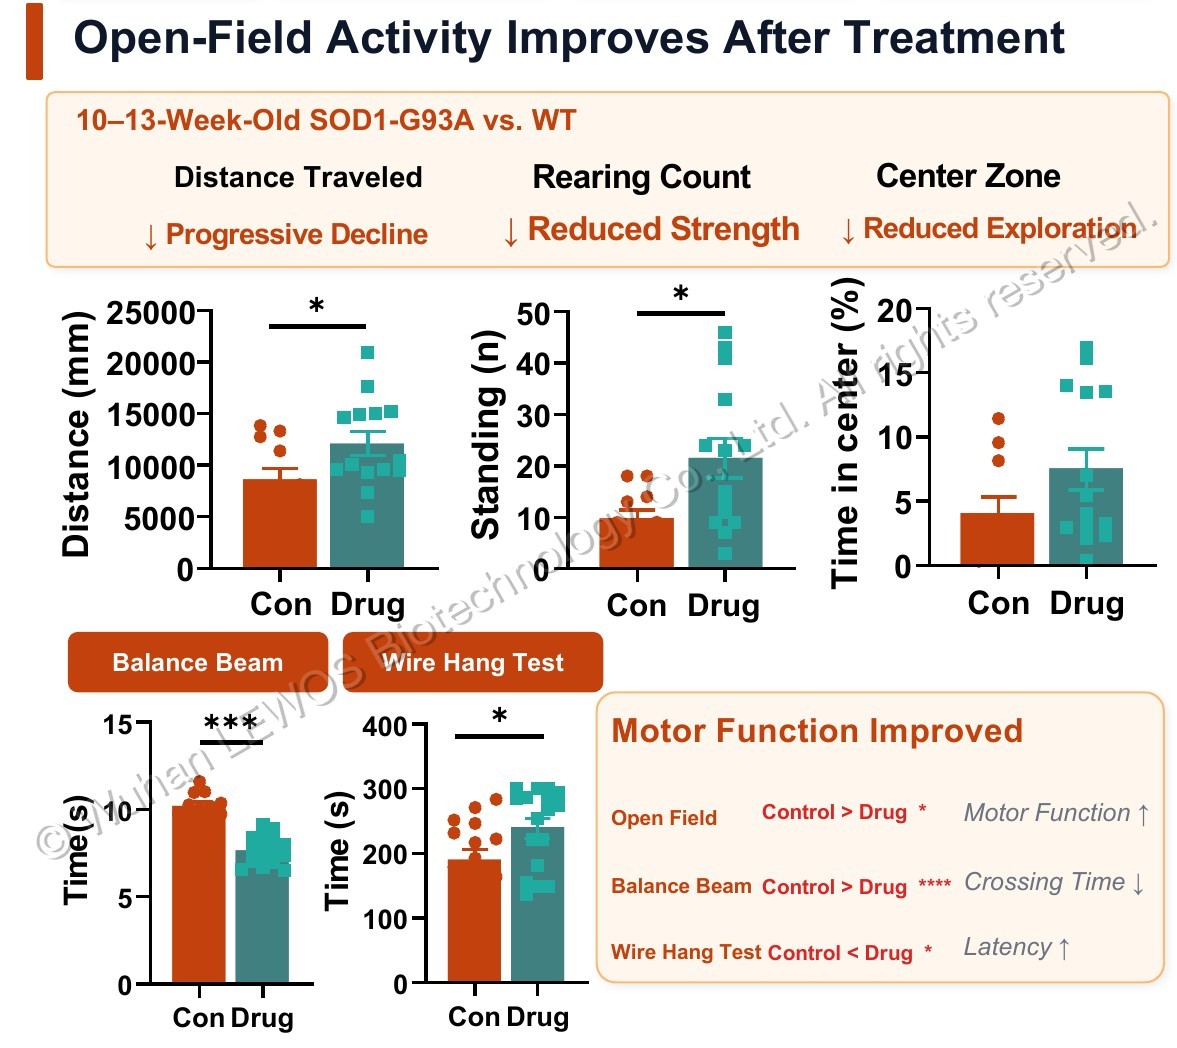
Spontaneous locomotor assessment · Open field test: progressive improvement in spontaneous locomotion after dosing
Open field spontaneous locomotion (distance travelled, time spent in the centre, number of rearings) and beam walk and wire hang test latency results in SOD1-G93A mice at 10–13 weeks of age versus WT controls, comparing the Con and Drug groups.
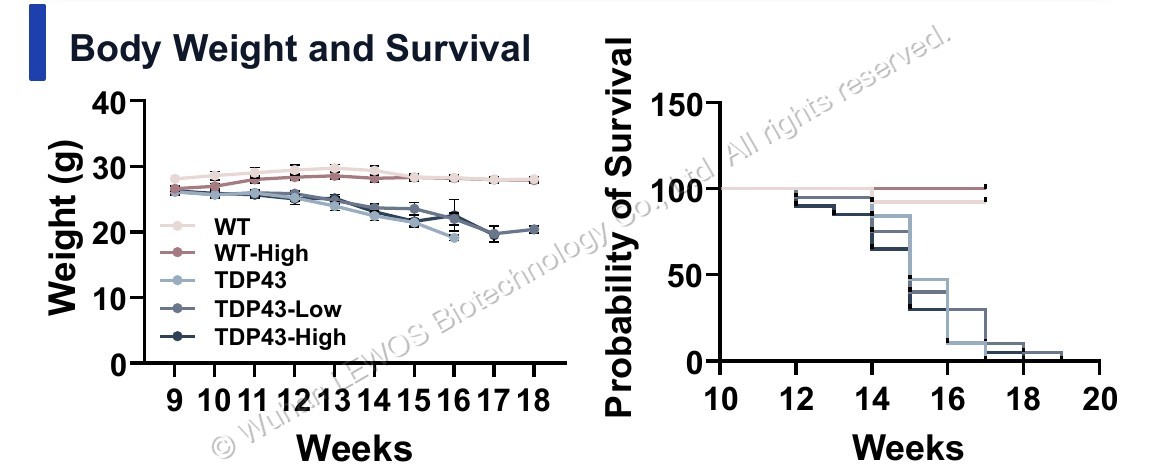
Body weight and survival
Body weight curves and survival probability curves for TDP-43 mice, comparing body weight change and survival rate with age in weeks (Weeks) across the five groups WT, WT-High, TDP43, TDP43-Low and TDP43-High.
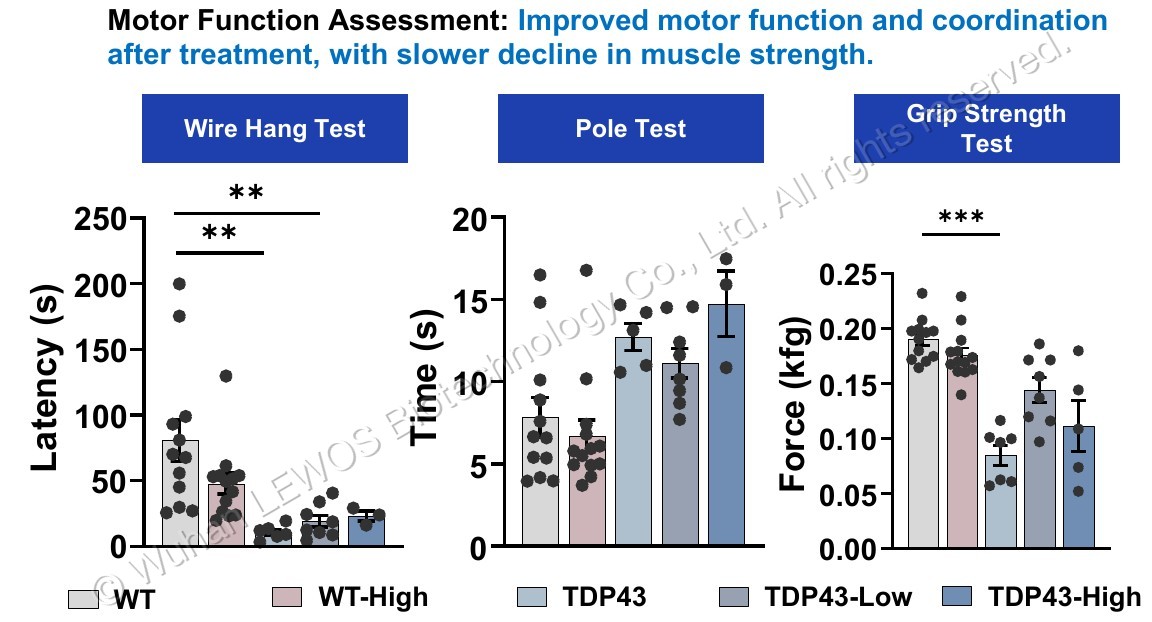
Core motor function assessment: improved motor function and coordination after dosing, delaying the trend of muscle strength decline
Wire hang test latency, pole test time and grip strength test results in TDP-43 mice after dosing, comparing the five groups WT, WT-High, TDP43, TDP43-Low and TDP43-High.
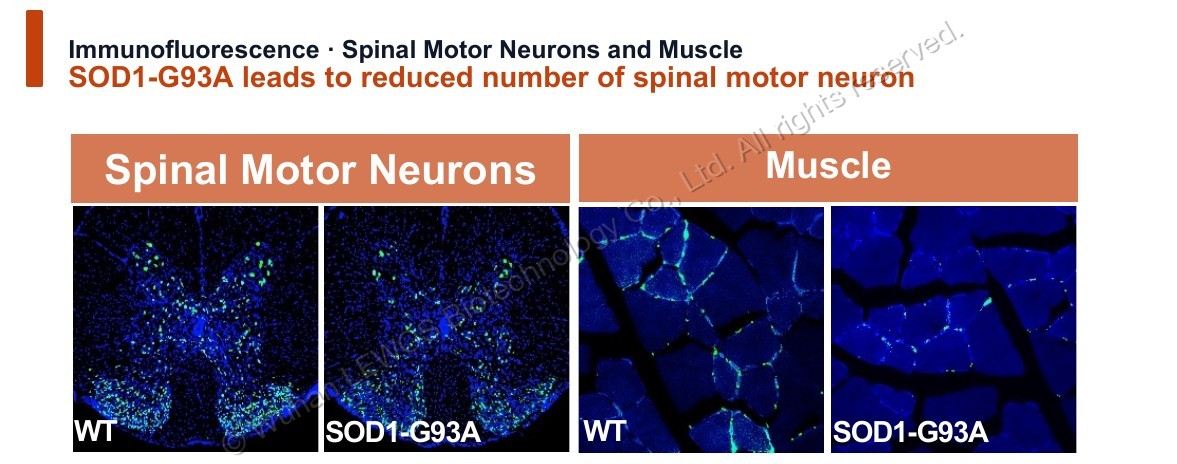
Immunofluorescence · Spinal motor neurons & neuromuscular junctions: reduced sensory neurons in the dorsal horn of the spinal cord and neuromuscular junction degeneration in SOD1G93A
Comparison of immunofluorescence of sensory neurons in the dorsal horn of the spinal cord and neuromuscular junction staining between SOD1-G93A and WT mice, showing reduced sensory neurons and neuromuscular junction degeneration in the SOD1-G93A group.
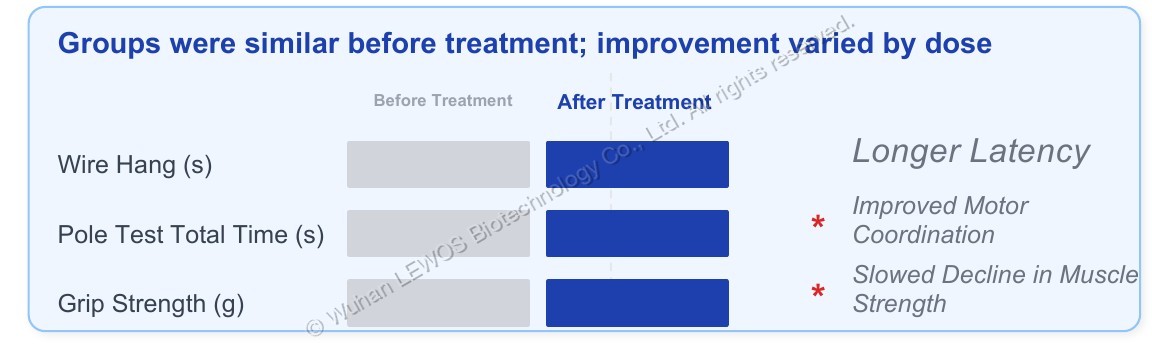
No difference between the two groups before dosing → different improvement effects at different doses after dosing
Summary table before/after dosing, listing the direction of improvement for three readouts — wire hang test (s), total pole test time (s) and grip strength (g) — across the different dose groups (prolonged latency, improved motor coordination, delayed decline in muscle strength).
Technical contact
Discuss your target, model or delivery question and learn about study plans, project scope and pricing.